Entrepreneurship
The State of Consumer Trust 2025: What 600,000+ merchants reveal about customer confidence


Judge.me’s analysis of millions of reviews reveals the hidden architecture of trust – and why most brands are focusing on the wrong areas
Introduction
Trust sits at the center of e-commerce. It’s what shapes every click, every purchase, and every recommendation. Yet many merchants misinterpret what drives it.
Brands choose to invest heavily in areas that have limited impact, while overlooking the fundamentals that influence whether a customer feels confident buying from them. This pattern appears repeatedly.
Some will assume that faster shipping will solve their problems, others will rapidly scale their support teams, thinking friendliness alone creates loyalty. They chase five-star ratings without understanding the reasons why customers settle on four.
The issue is rarely a lack of effort – it’s more about the direction of that effort.
Many merchants are improving the wrong things and Judge.me has a unique vantage point on this. As the largest review platform on Shopify, working with more than 600,000 stores, Judge.me is able to observe what customers actually say at the moment of truth.
These are not survey responses or prompted opinions. They are real, unsolicited comments from millions of buyers explaining precisely what worked, what disappointed them, and why their trust either strengthened or weakened.
This report outlines the recurring patterns from millions of data points. In this report, “sentiment” refers to the overall emotional tone conveyed in written reviews – positive, neutral, or negative.
The analysis of sentiment is done through key topics such as product quality, delivery, perceived value, design, customer service, and more.
Each topic carries its own influence. Together, they provide a complete view of consumer trust.
A crucial point upfront: star ratings and sentiment are not identical. They correlate strongly – more than 80% – but sentiment adds depth that star ratings cannot capture.
A five-star rating reveals satisfaction, whereas sentiment uncovers the reasons behind it. It highlights the emotional tone of a review, the specific touchpoints that influenced it, and the elements that reinforced or damaged trust.
The trust hierarchy: Why perceived value matters 55% more than service excellence
We examined four core pillars that determine whether customers trust a brand:
Perceived value
Product excellence
Service excellence
Delivery performance
These pillars represent the main elements customers assess when deciding whether a brand met their expectations.
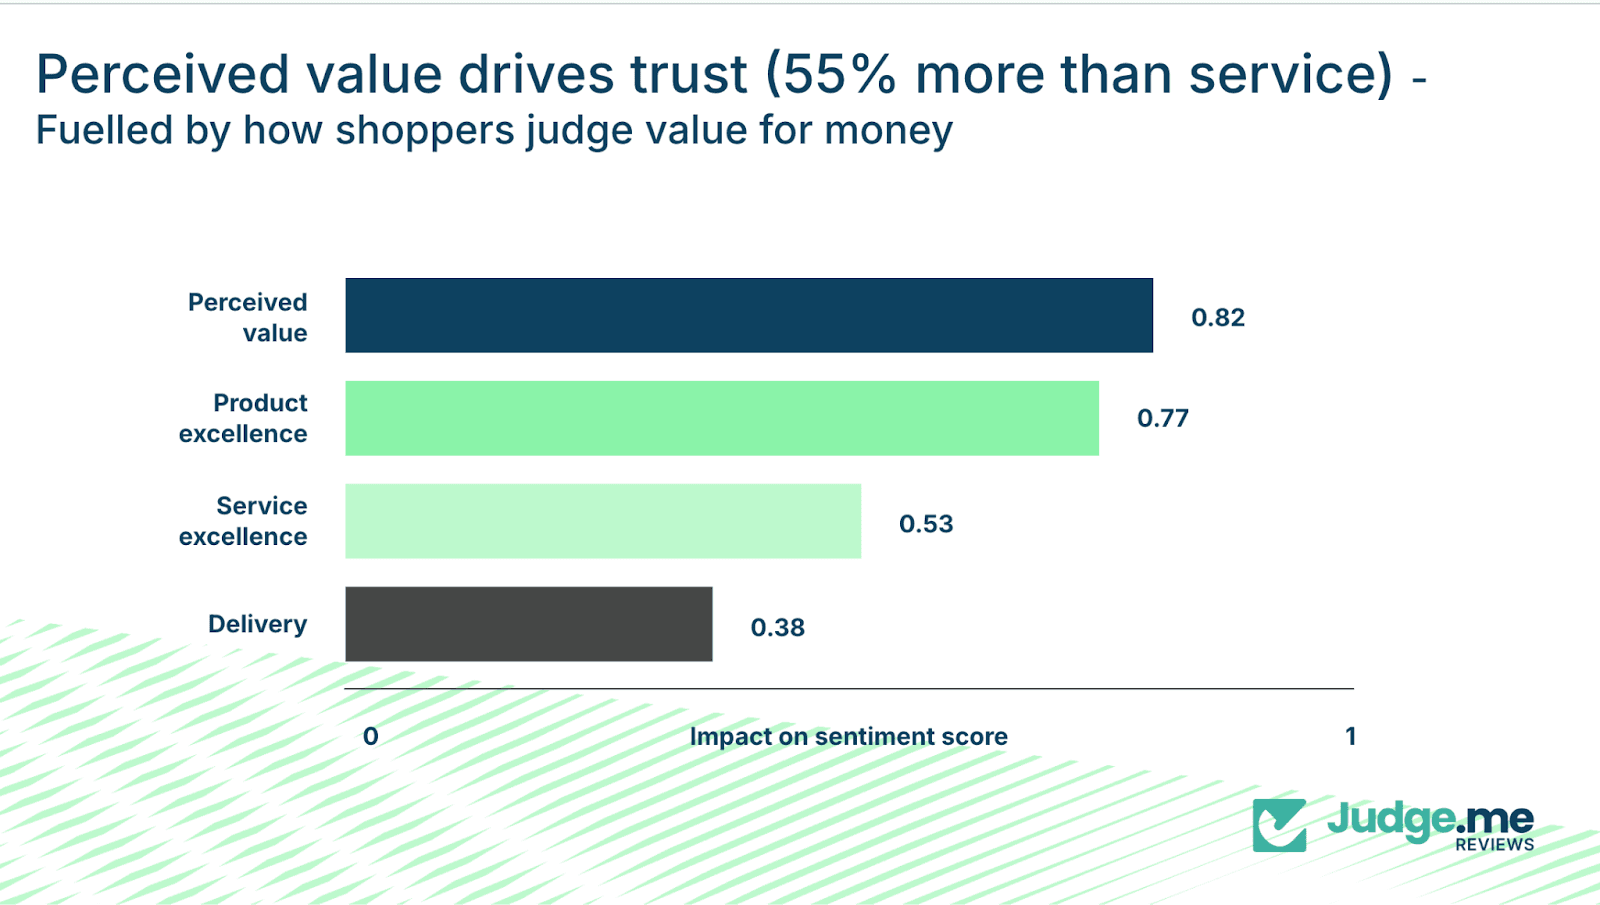
The results are clear. Perceived value – the customer’s judgment of whether the product was worth the money – has an impact coefficient of 0.82. Product excellence follows at 0.77. Service excellence scores 0.53, and delivery sits at 0.38.
Perceived value therefore carries 55% more impact than service excellence and almost double the impact of delivery.
This challenges common assumptions. Even the friendliest support team or fastest delivery cannot compensate for a customer who believes the product was not worth the price.
Value for money is not about being cheaper
Perceived value is not driven by low pricing, it’s shaped by whether the customer feels the experience aligned with what they paid.
When value perception is strong, minor issues remain minor. A slightly delayed parcel becomes a non-issue, packaging imperfections feel negligible, and the product earns the benefit of the doubt.
When value perception collapses, every detail becomes a point of frustration. Delivery feels slower and product quality receives heightened scrutiny.
The same experience produces a very different reaction depending on whether the customer feels their money was well spent.
Ultimately, perceived value is the foundation on which customer trust and loyalty are built.
The 3× rule: One driver outweighs everything else
When you analyze the specific drivers within these pillars, the dominance of value becomes even more pronounced.
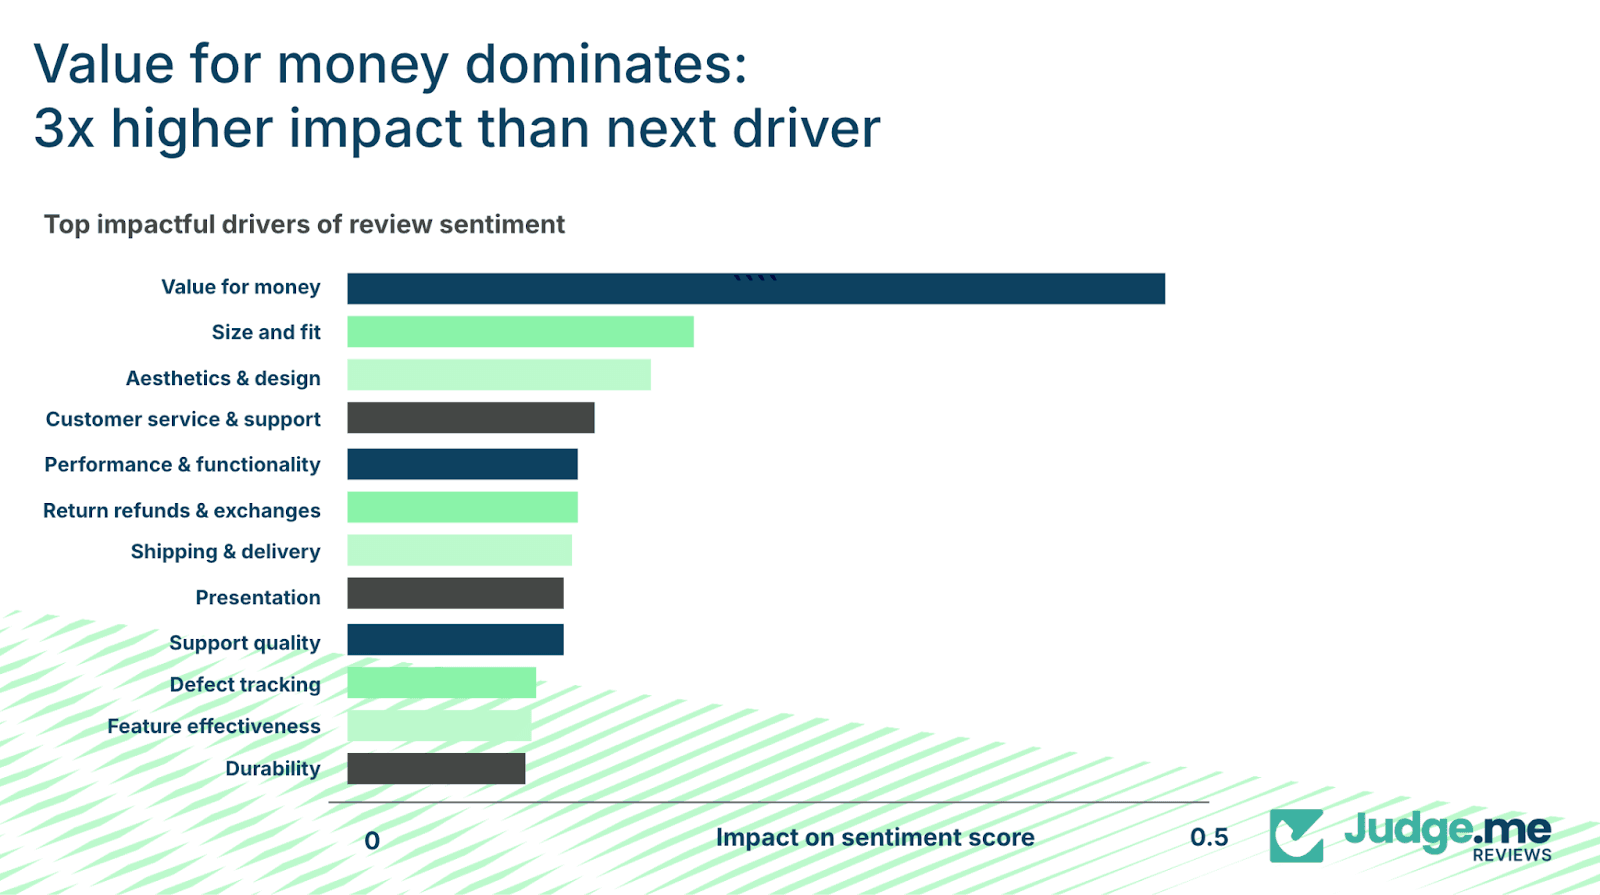
“Value for money” carries roughly three times the impact of the next strongest driver. Other elements like size and fit, design, service quality, performance, returns, shipping, presentation, durability etc. all play meaningful roles.
However, none of the above heavily impact the influence of perceived value.
Value perception is shaped by evidence gathered across the entire journey: material quality, reliability, packaging care, price transparency, honest descriptions, guarantees, and responsive support when needed. The types of things that must be demonstrated consistently.
Key takeaways for merchants
Making value visible across the journey.
Clear explanations of quality, guarantees, and materials help customers understand what justifies the price.Signalling fairness throughout.
Transparent pricing, clear shipping costs, accurate expectations, and no hidden surprises reinforce trust.Using post-purchase touchpoints to reinforce the purchase decision.
Packaging, follow-ups, and review responses should all underline why the product was worth the money.
Customers mention “Price” 4.5× more in negative reviews – but it’s not always about cost
A notable pattern in the data is the behavior of price mentions.
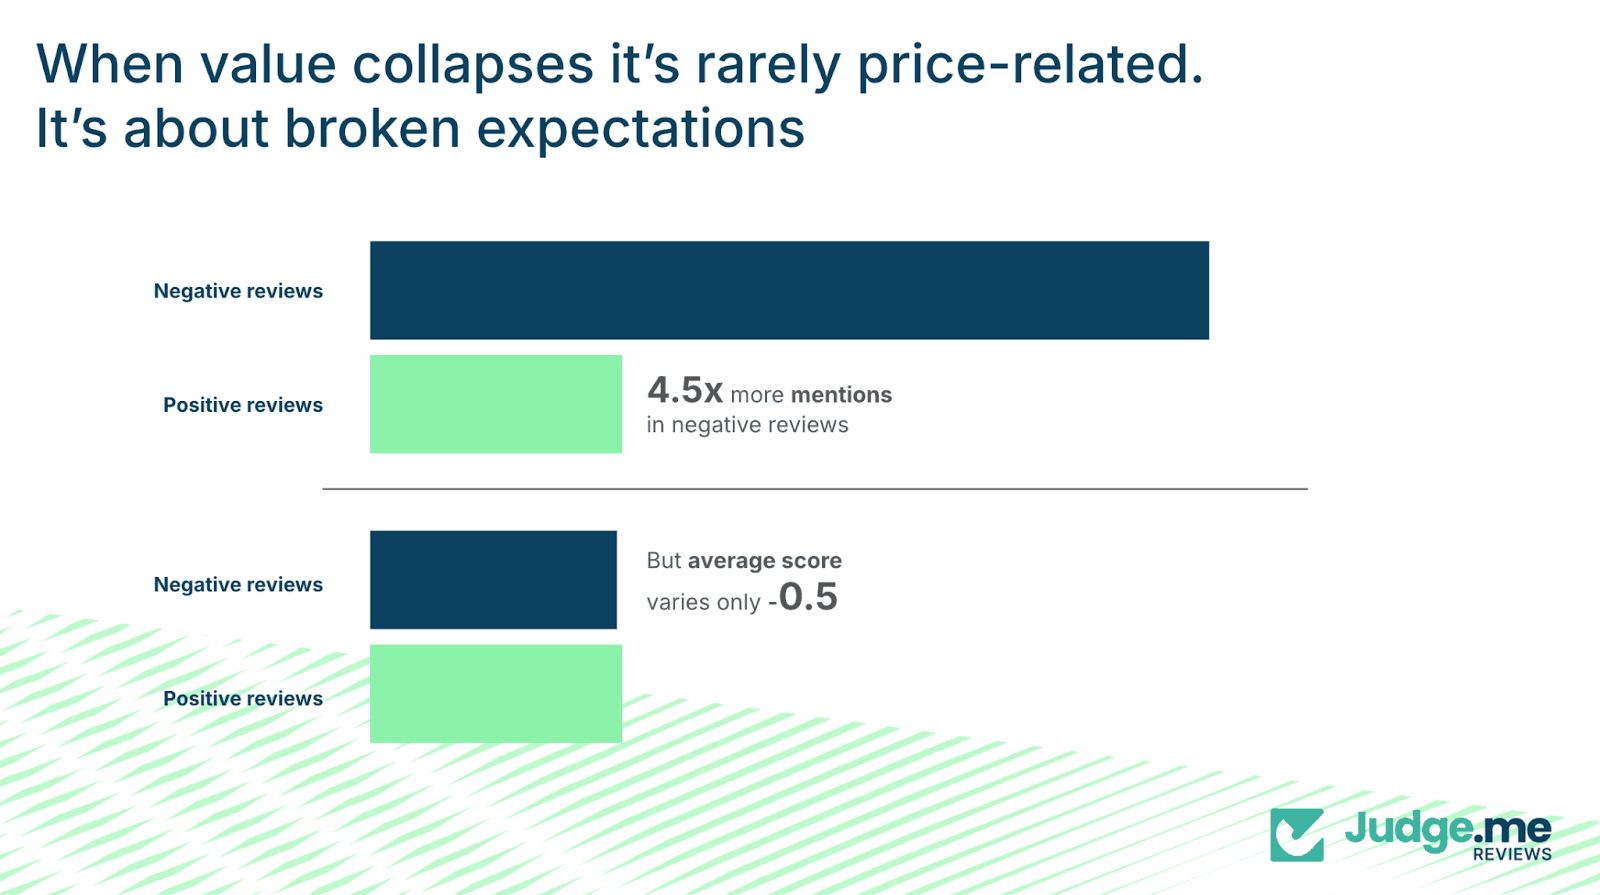
In reviews with the lowest sentiment scores, customers reference price 4.5 times more often than in the highest-sentiment reviews – 0.9 mentions per review in the bottom 10% of sentiment versus 0.2 in the top 10%.
However, the sentiment score for price drops by only 0.5 points between positive and negative reviews.
This indicates that customers are not actually claiming that the absolute price was unreasonable. Instead, they use price to express broader disappointment.
Broken expectations drive price complaints
Customers often lack the language to articulate that the experience did not justify the cost.
When a product feels lower quality than expected, when delivery is significantly delayed, or when returns require unnecessary effort, customers use phrases like “not worth the money” to summarize the overall shortfall.
Price becomes the placeholder for a wider experience gap. Merchants often respond by discounting, assuming the issue is cost.
However, this rarely addresses the underlying cause. It reduces margins without resolving the real driver, which typically sits within quality, expectations, or operations.
Key takeaways for merchants
Audit where expectations are set versus where they're delivered.
The gap between those two points is the killer. If your product page promises premium quality, but the product arrives feeling cheap, that's a broken expectation. Similarly, if your imagery suggests luxury, but the packaging is flimsy, they are both broken expectations. Try to map the full journey of your product, and find the gaps.Analyze your "price complaint" reviews for the real underlying issue.
Read past the mention of cost. What else appears in those reviews? Late delivery? Difficult returns? Product defects? Poor support? Usually, you'll find the operational issue hiding behind the price complaint. Fix that, and the price complaints often vanish.Re-explain value instead of cutting price.
Sometimes customers just need reminding of what makes the purchase worthwhile. Use review responses to highlight guarantees, send follow-up emails reinforcing quality commitments, or even just simply update product descriptions to make value more visible.
Product excellence doubles sentiment compared to delivery, delivery influences final impressions
Market norms suggest delivery speed is a major driver of satisfaction. However, the data shows a different pattern.
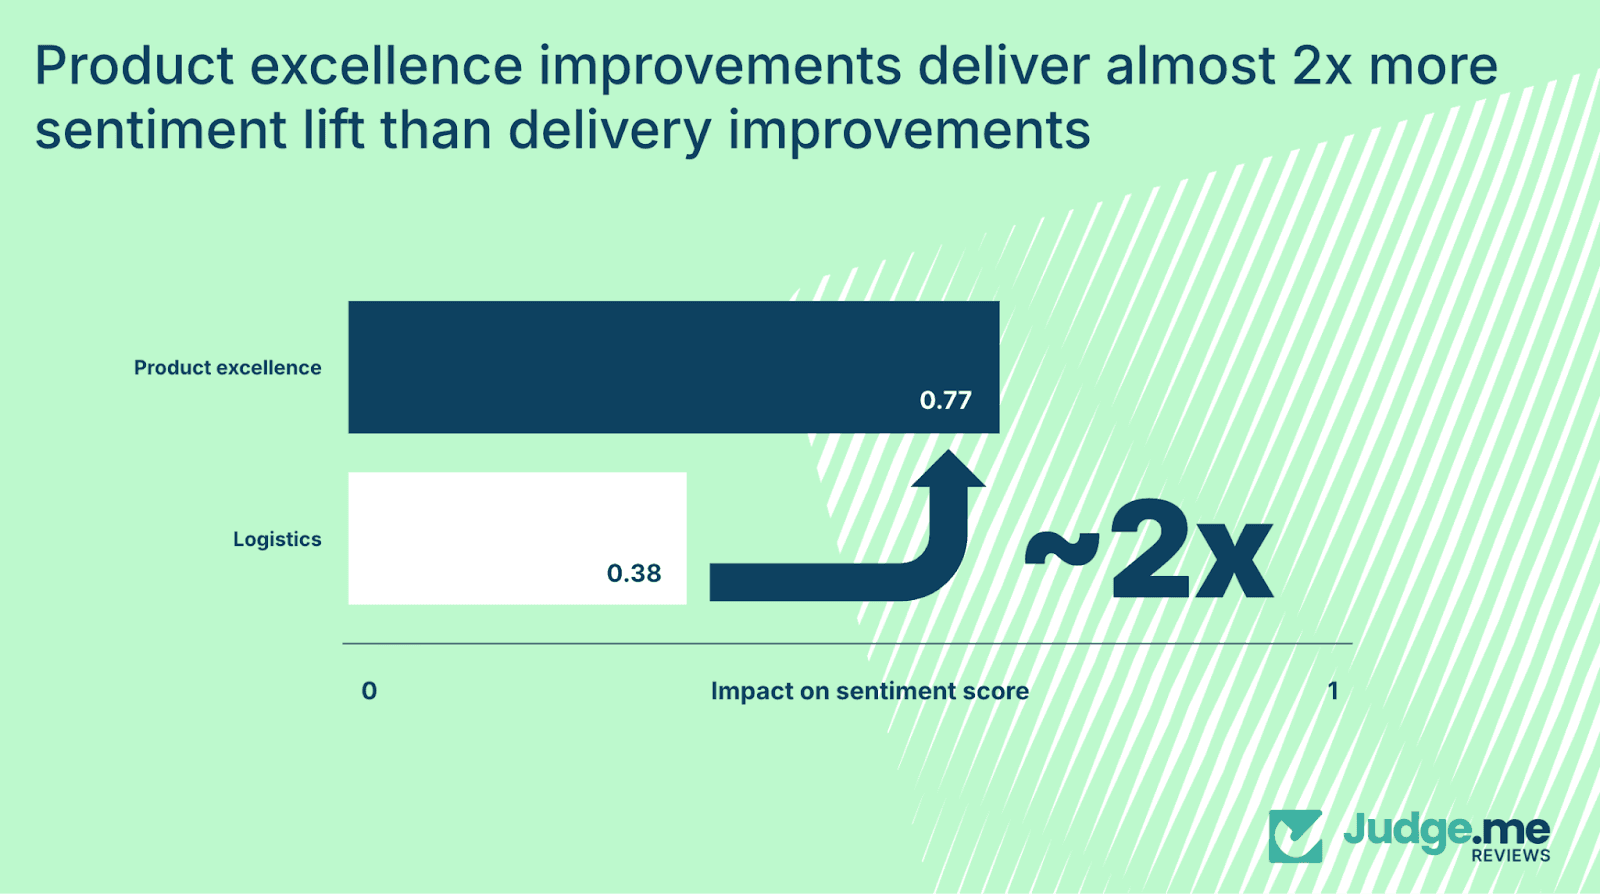
Improvements in product excellence generate almost twice the sentiment lift of improvements in delivery. Product excellence has a coefficient of 0.77 compared with 0.38 for delivery.
Customers are willing to accept slower delivery when the product meets or exceeds expectations.
The dataset contains many instances of delayed deliveries paired with strong overall sentiment because the product itself impressed the buyer.
Fast, reliable delivery cannot compensate for products that feel poorly made, misrepresented, or fragile. When a product fails to match expectations, trust declines regardless of speed.
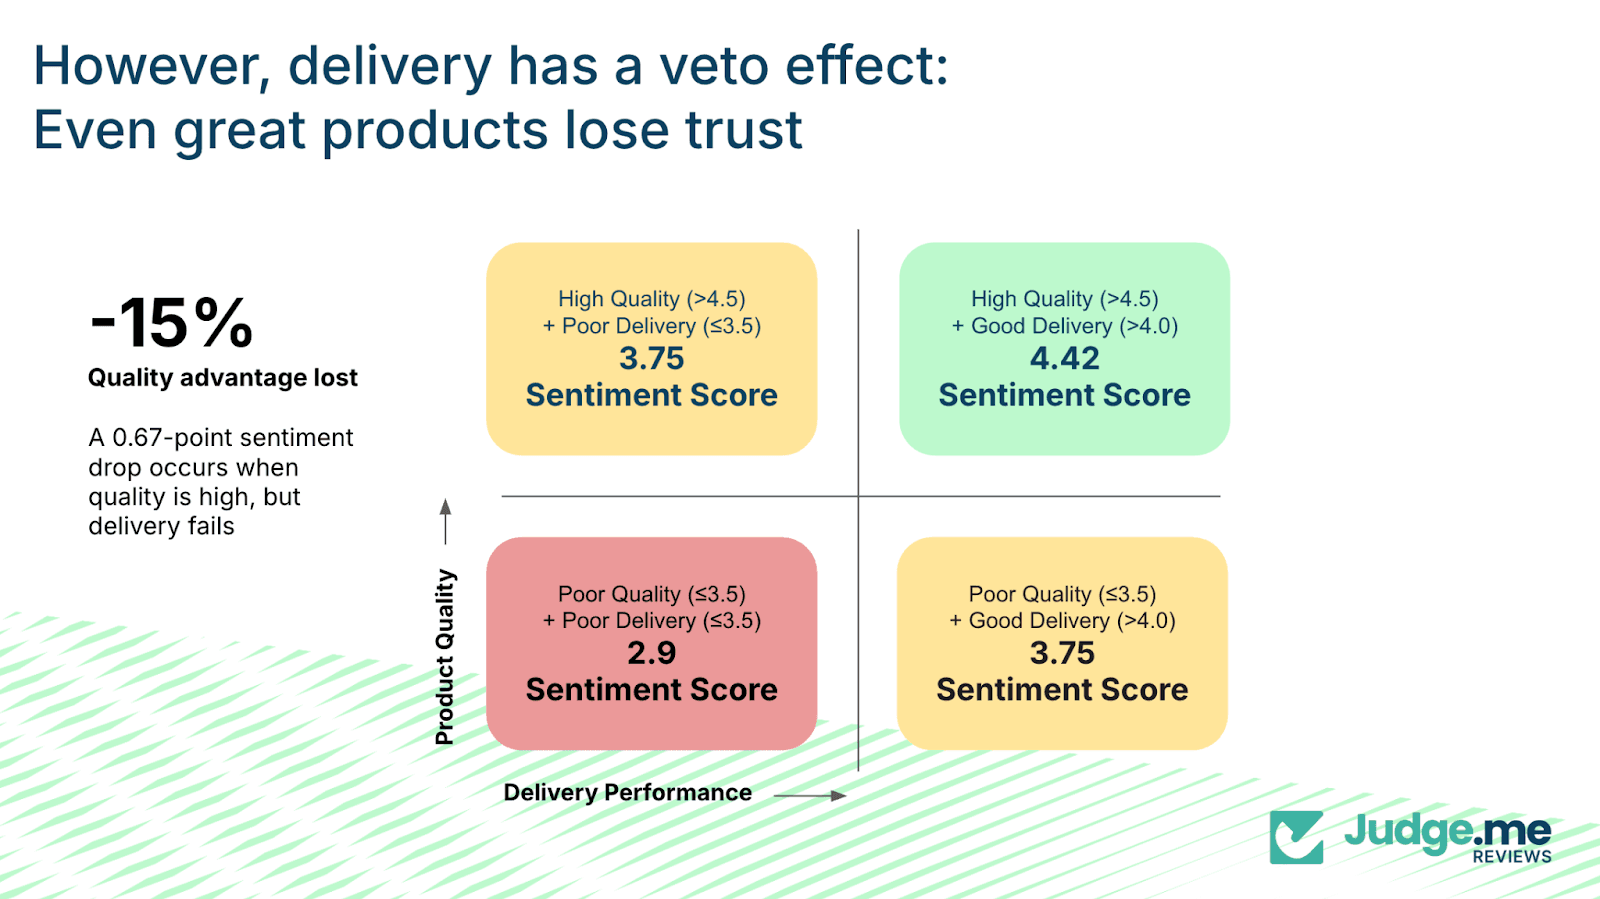
The veto effect: When great products lose to poor logistics
While delivery improvements have smaller overall impact, poor delivery can materially reduce sentiment even when product quality is high. This is the “veto effect”.
While delivery improvements have smaller overall impact, poor delivery can materially reduce sentiment even when product quality is high. This is the “veto effect”.
When product quality sentiment is strong and delivery sentiment is at least adequate, overall sentiment sits at 4.42 out of 5.
When product quality remains strong, but delivery performance drops into the lower range, sentiment falls to 3.75 – a decline of 0.67 points, or 15%.
In these cases, customers never reach the point where they can appreciate the product because the delivery experience overshadows it. Lost parcels, extensive delays, or damaged goods shift the entire interaction.
Good enough delivery is the target
The good news: You don't need perfect delivery. You need "good enough" delivery.
Take a look at these authentic reviews from the dataset, all of them five-star ratings with sentiment scores above 4.0:
"The sweatshirt arrived in a reasonable time and looked just like the preview picture. The preview picture is very helpful when ordering. Shirt quality is good. Only time will tell about the printing." Rating: 5, Sentiment: 4.4/5
"Took a while till the order arrived to Germany, but everything was okay. The pendant looks really awesome. I bought the small version of the pendant. Will order again soon here. Thanks." Rating: 5, Sentiment: 4.4/5
"Mailing package was good, secure. Assembly was easy, mounting took some modifying. Love the dimmer switch and its easy accessibility. Great for a 2x4 grow tent." Rating: 5, Sentiment: 4.3/5
The dataset shows that customers respond well to delivery that is consistent, transparent, and adequate. They describe these experiences as “reasonable time”, “took a while but fine”, and “secure packaging”.
These reviews still achieve high sentiment scores because the delivery experience did not interfere with the value of the product.
Increasing delivery performance far beyond this threshold generates diminishing returns. Once logistics reach a predictable and acceptable level (roughly equivalent to a sentiment score of 3.75) further investment produces limited sentiment uplift.
The major gains come from moving delivery performance from below this threshold to at or above it.
Key takeaways for merchants
A brands delivery strategy should be built around:
Accurate delivery expectations.
Customers respond more favorably to realistic timeframes that are consistently met than to ambitious promises that slip.Avoiding unnecessary logistics spend.
Once delivery stabilizes at an acceptable level, additional improvements produce limited impact. At that point, resources are better directed to strengthening product quality.Resolving delivery issues before refining product.
Poor delivery blocks positive sentiment. Stabilizing fulfillment should precede deeper product enhancements.Investing in product excellence once delivery is reliable.
Product improvements deliver significantly higher returns. Enhancing materials, design, durability, and functionality produces more lasting sentiment gains.
Great service offsets poor delivery by 55% – but only 31% for poor products
Customer service is designed to resolve problems when something goes wrong. It is the point at which brands can influence the outcome of an initially negative experience.
However, its effectiveness varies depending on the nature of the issue.
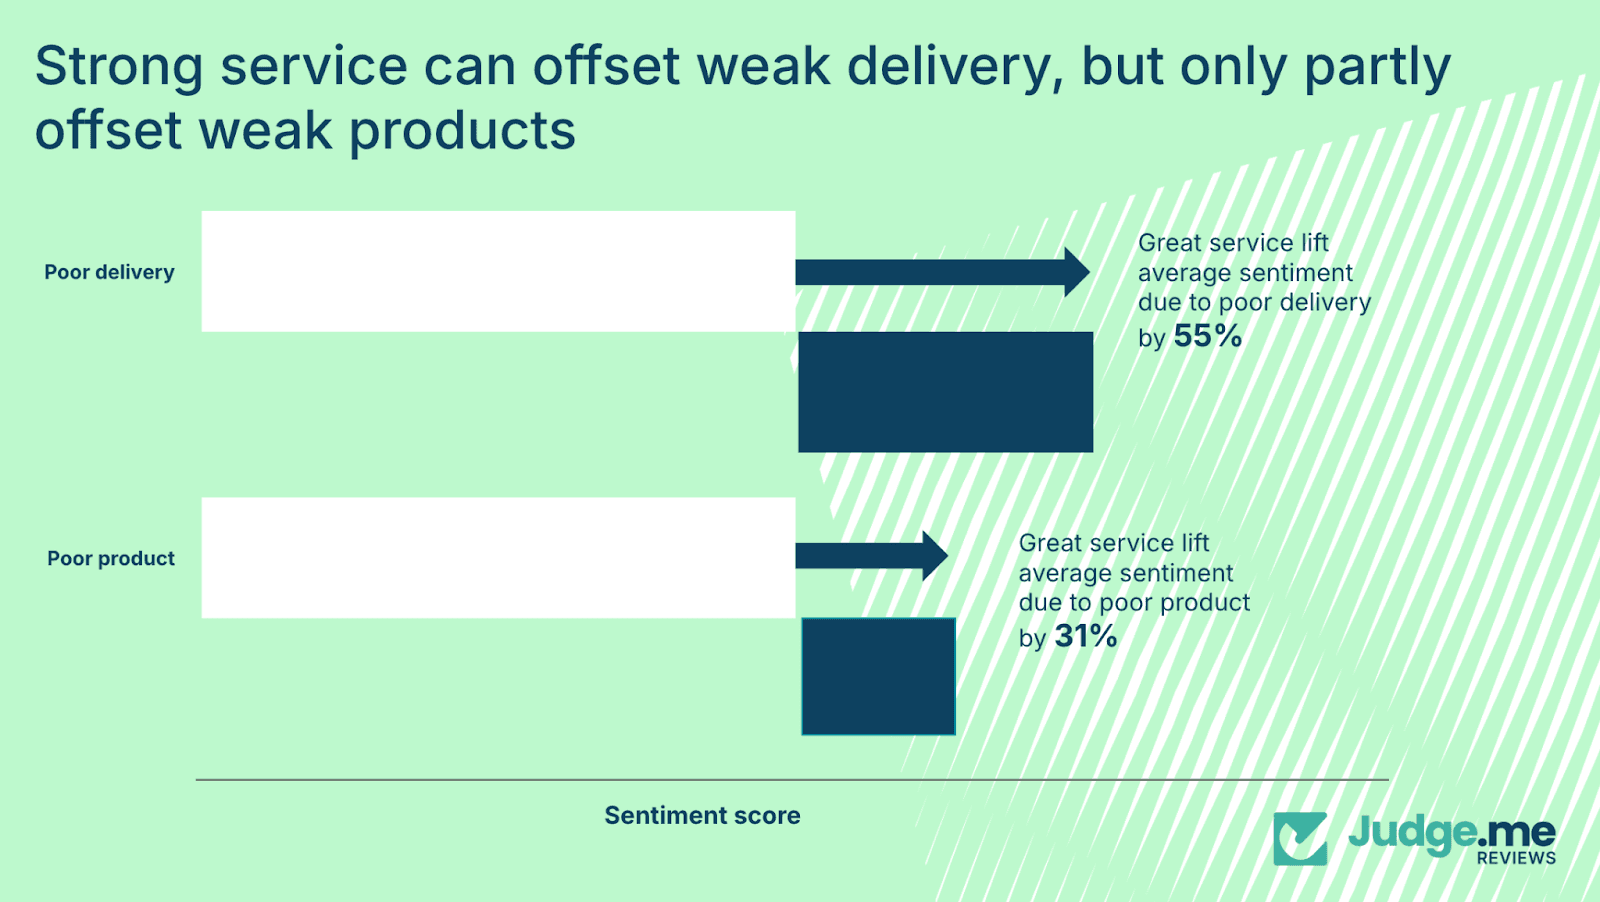
Service can significantly improve sentiment when the core problem relates to delivery. When delivery performs poorly, strong customer service can raise sentiment by 55%.
This reflects the perception that delivery problems often sit outside the brand’s direct control. Customers interpret them as logistical disruptions rather than deliberate failings.
In contrast, service has a more limited effect when the issue is product-related. For disappointing products, even excellent service generates only a 31% uplift in sentiment. Customers see product quality as a direct representation of the brand’s standards.
When the product falls short, trust is affected at a more fundamental level, and service cannot fully compensate.
Why delivery issues are more recoverable
Delivery problems tend to feel external. A missed delivery window, transit damage, or tracking issues are usually attributed to the carrier.
When the brand intervenes promptly – offering clarity, solutions, or replacements – customers often view the response positively. The organization appears proactive and responsible, which helps restore confidence.
Product issues feel more intrinsic. Inquiries about defects, reliability, performance, or misaligned expectations point directly to the brand’s decisions.
Customers interpret these problems as choices made by the business and even an efficient resolution does not fully offset the initial impression.
The imbalance of recovery
This creates an asymmetry in how you should deploy support resources. For delivery issues, service is highly effective.
Look to invest in proactive outreach for delayed shipments and empower support teams to offer immediate resolutions, with a focus on communicating with clear ownership and urgency.
A customer whose package arrived late but received exceptional support often leaves a positive review praising how the brand handled the situation.
For product issues, service is less effective. This doesn't mean you shouldn't provide great support for product problems – you absolutely should.
But understand that service alone can't rescue a fundamentally flawed product. If you're seeing consistent product quality complaints, the answer isn't better support. It's better products.
Service should follow problem resolution, not replace it.
Key takeaways for merchants
Service resources should be deployed with the nature of the issue in mind:
Resolve underlying issues before relying on service.
Service can mitigate frustration but cannot correct recurring defects or operational weaknesses. Sustained improvements require addressing the root cause first.Prioritize effective recovery processes for delivery problems.
Proactive communication, quick resolution, and empowered support teams deliver meaningful sentiment improvements. These interventions help customers see delivery problems as exceptions rather than recurring risks.Reinforce fairness during recovery moments.
Clear explanations, consistent communication, and reliable follow-through help customers regain confidence. Service should emphasize transparency and reinforce the guarantees supporting the product.
Billing errors appear in <0.3% of reviews – but are 40% more damaging than returns problems
Some issues occur infrequently but carry disproportionate impact. Billing and payment errors fall into this category, appearing in fewer than 0.3% of reviews – yet the produce the most severe sentiment drops.
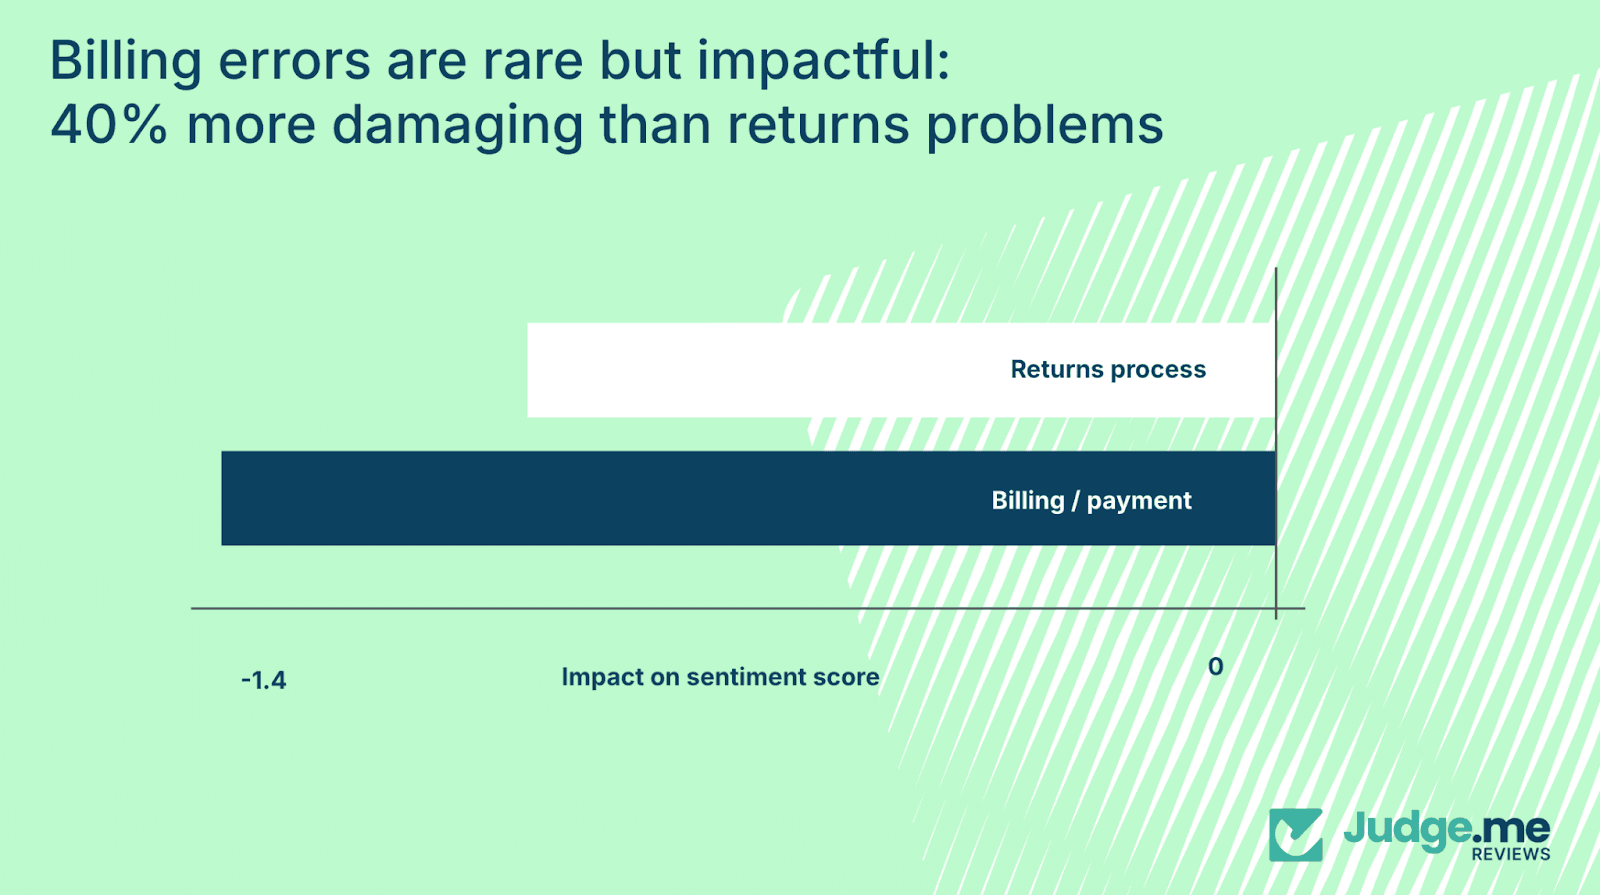
Billing issues reduce sentiment by –1.4 points, compared with –1.0 for returns problems. This represents a 40% higher impact.
A sentiment decline of this size often shifts a customer from a marginally negative experience to a strongly negative one. It also affects long-term trust and repeat purchase behavior.
Why billing errors cause such substantial damage
Billing problems touch on financial accuracy and fairness. When customers experience unexpected charges, duplicate payments, unclear fees, or processing failures, the incident affects their confidence in the brand.
These experiences create a perception of either operational unreliability or a risk of being overcharged.
Customers are more forgiving of operational inconvenience than of financial mistakes. A delayed parcel or complex return is irritating but manageable.
Billing issues feel more significant because they concern the customer’s money directly.
The lasting impact of return friction
Returns create a different kind of trust damage – not from catastrophic failure, but from accumulated friction.
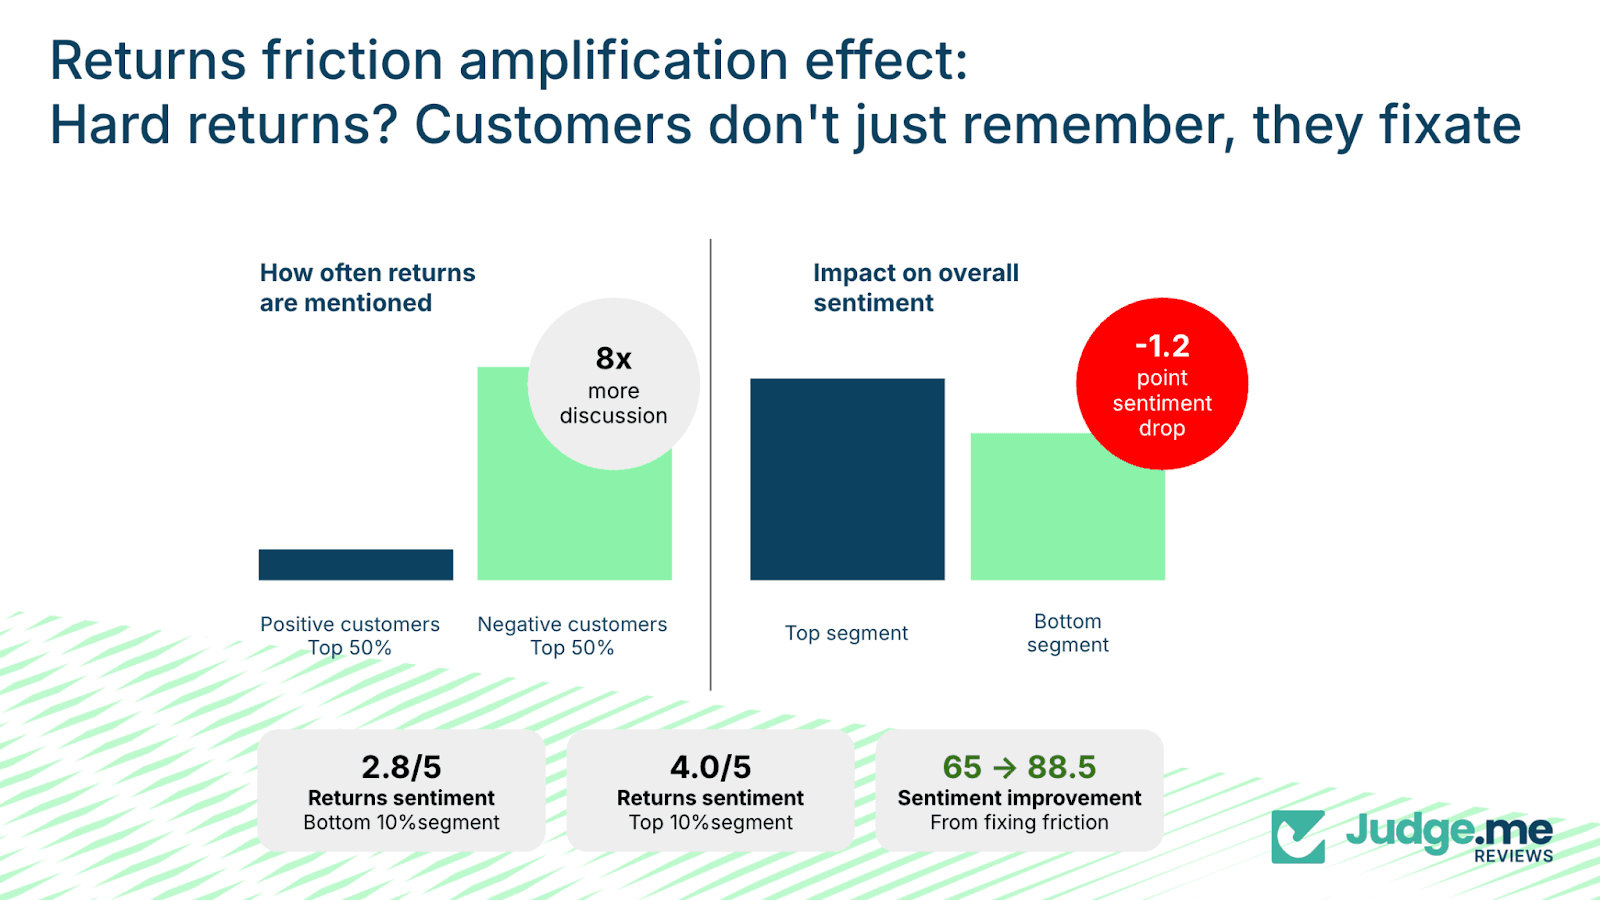
Returns issues are more common and produce consistent frustration. The dataset shows that customers in the bottom 50 percent of sentiment mention returns eight times more frequently- 0.8 mentions per review, compared with 0.1 in the top half.
Sentiment decreases by 1.2 points between these groups.
This pattern reflects the emotional baseline of returns. The customer is already disappointed with the product and begins the process at a disadvantage.
Every additional step – printing labels, packing items, waiting for processing, monitoring refunds, answering follow-up questions – increases the sense of effort required.
The outcome may be fair, but the effort shapes the memory of the experience.
Neutral sentiment can indicate hidden friction
There's a third hidden killer: high mention frequency combined with neutral sentiment.
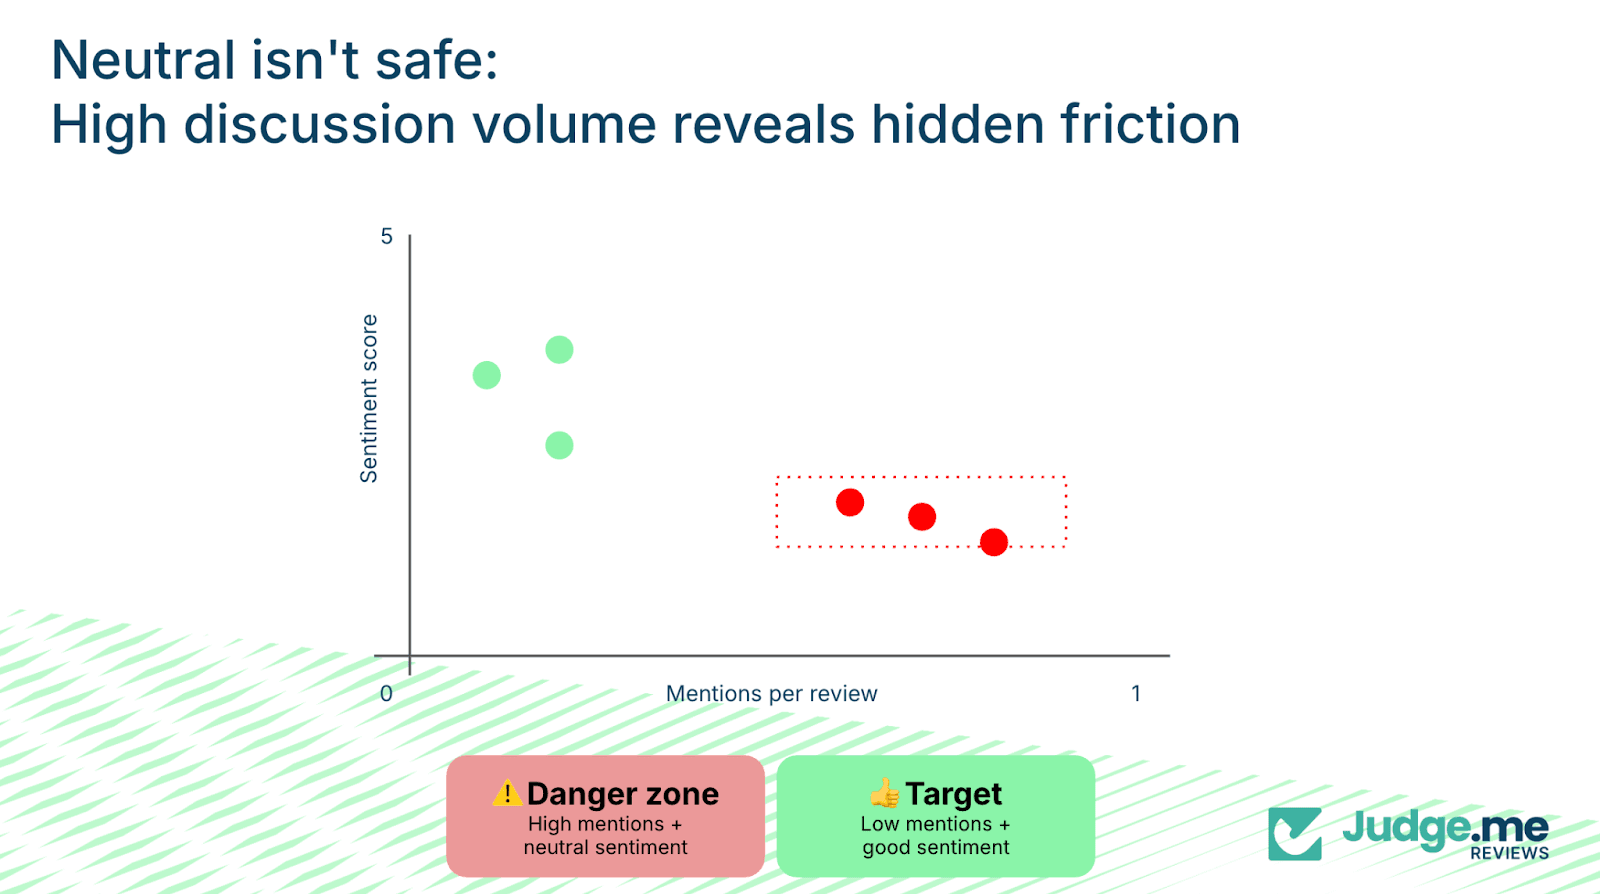
Customers rarely discuss experiences that were genuinely smooth or unremarkable. High mention frequency combined with neutral sentiment signals, areas where the process required more cognitive effort than expected.
Examples include installation, setup, or checkout steps that technically worked but demanded additional time or interpretation.
These experiences are not severe enough to generate strong dissatisfaction, yet they create friction that customers still remember. High mention volume in these scenarios often identifies early-stage operational weaknesses.
Real examples from reviews with 3.0/5 sentiment:
"The setup was a bit tricky, but I got it working eventually. Would be nice if the instructions were clearer." Four stars.
"Took me a while to figure out how to install the software, instructions weren't clear, but it works fine now." Four stars.
Neither customer is angry, and both are giving decent ratings. But both are telling you this took work and that they had to think about it, troubleshoot it, remember it enough to mention it.
That's the danger zone: high mentions plus neutral sentiment. It signals hidden friction – processes that aren't broken enough to generate complaints, but aren't smooth enough to fade into the background.
Compare this to your top performers: they will barely mention setup, installation, checkout. Not because these steps don't exist, but because the processes are forgettable in the best way. They just work.
Key takeaways for merchants
A structured approach to these trust risks includes:
For billing and payment:
Regular audits of the full payment flow to identify inconsistencies or errors.
Clear communication around refunds, including progress updates and expected timelines.
Treating billing errors as significant trust incidents rather than routine support queries.
For returns friction:
Reducing manual steps and repeated effort through automation and pre-filled processes.
Providing clear instructions and consistent updates during the return.
Monitoring return-related mentions to assess whether the process is becoming a noticeable point of friction.
For neutral-sentiment friction points:
Tracking mention frequency to identify areas that require refinement.
Reviewing three- and four-star reviews to detect early indicators of friction.
Observing new users completing these steps to uncover hesitation points.
Geography and product category create some disparities: why would a Swiss shopper rate 28% higher than a Mexican?
Not all improvements are equal, and where you invest should depend on two critical contexts: your product category and your geographic markets.
Category sensitivity determines where improvements matter most
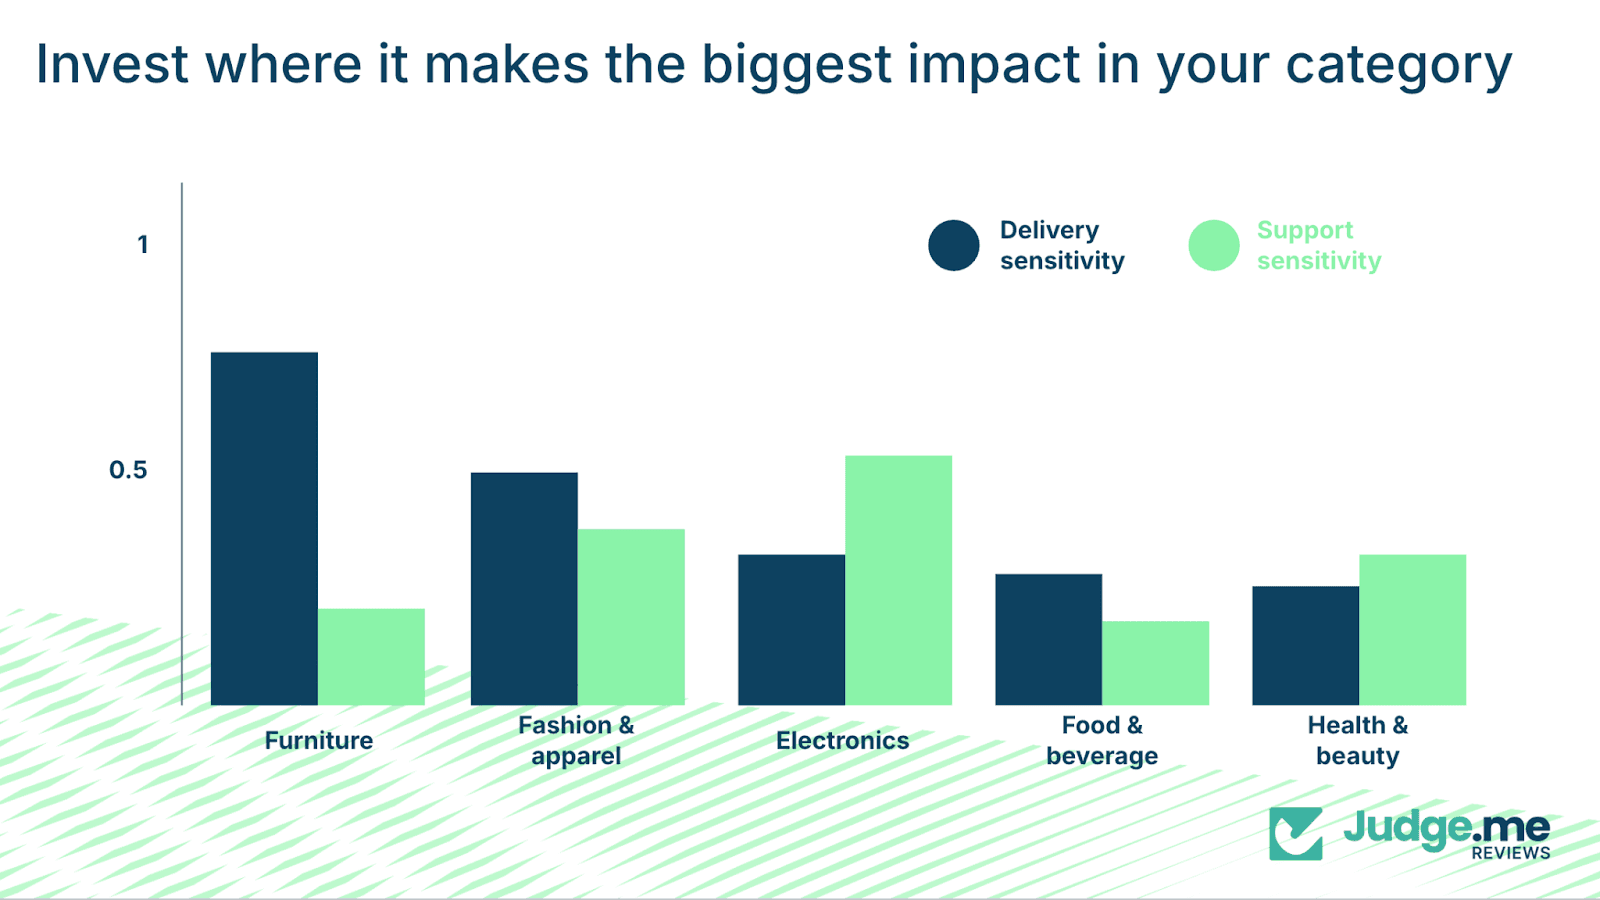
Different product categories display different sensitivities to delivery and service performance.
Furniture shows the highest delivery sensitivity at 0.72, almost twice the level seen in food and beverage at 0.39. Larger items, longer delivery windows, and higher risk of damage make delivery performance more impactful in this category.
Electronics displays the highest service sensitivity at 0.52, compared with 0.20 in food and beverage. Buyers of electronics depend on reliable support for setup, troubleshooting, and technical issues.
The nature of the product makes support competence more important than delivery speed, but industries such as fashion, apparel, health, beauty, and other categories sit between these extremes.
Customers in these areas tend to evaluate the entire experience without one specific driver dominating as strongly.
These differences indicate that brands should allocate resources according to their category’s multiplier, rather than applying uniform improvements across all areas.
Focusing in on localization if selling globally
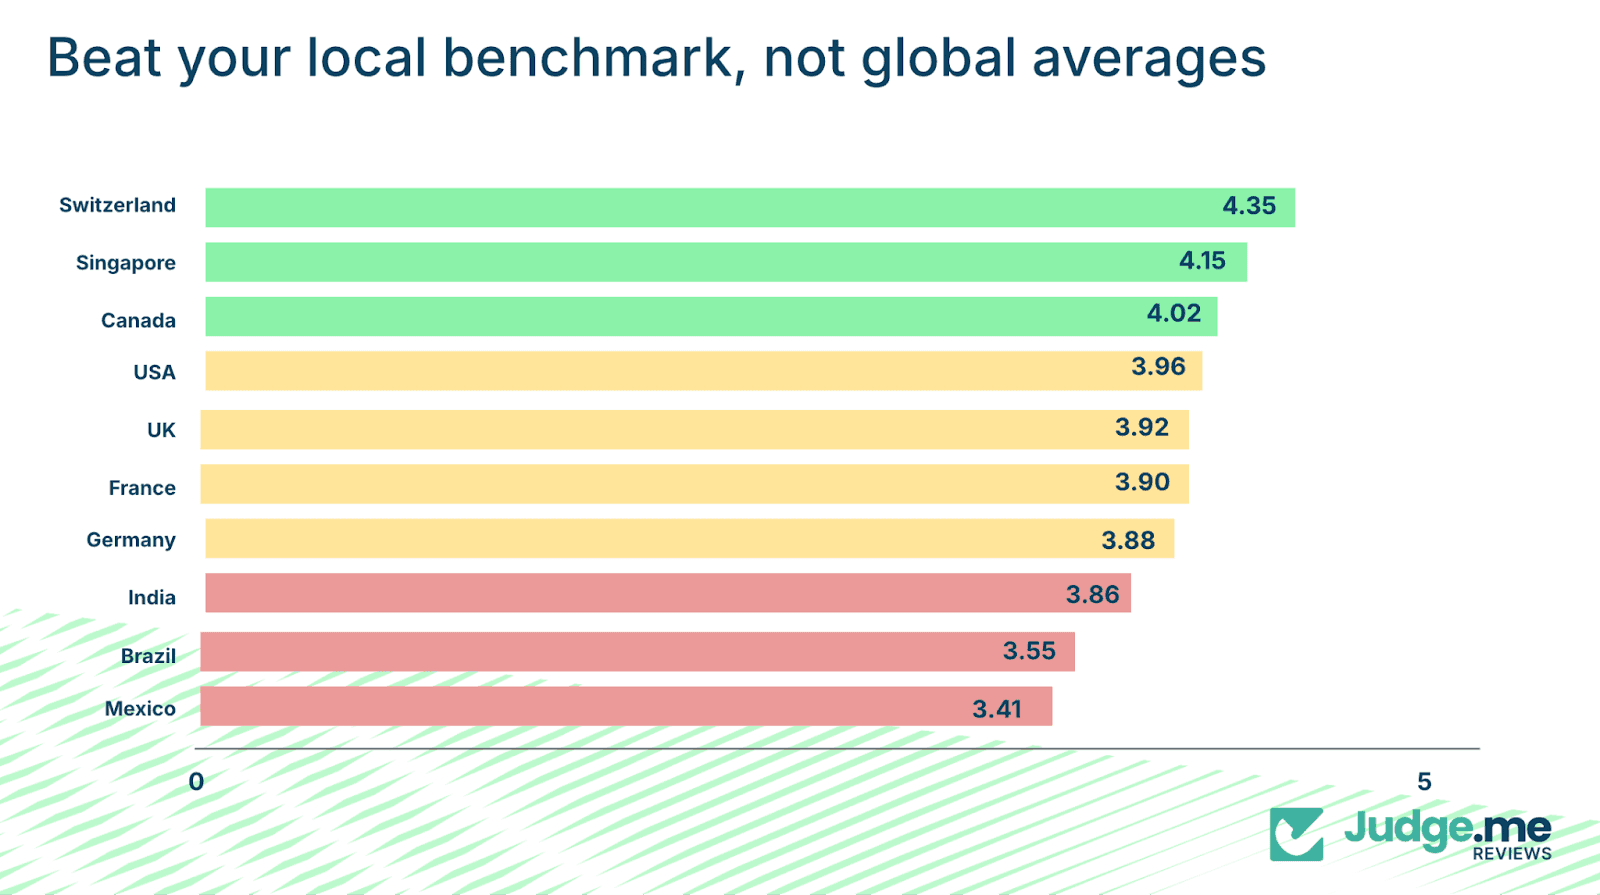
Sentiment varies significantly across countries. Switzerland has an average sentiment of 4.35/5, compared with 3.41/5 in Mexico.
This 0.94-point spread reflects differences in expectations, communication styles, and cultural norms rather than performance disparities.
Here are some examples:
Switzerland: 4.35/5
Singapore: 4.15/5
Canada: 4.02/5
USA: 3.96/5
UK: 3.92/5
France: 3.90/5
Germany: 3.88/5
India: 3.86/5
Brazil: 3.55/5
Mexico: 3.41/5
Brands should evaluate performance relative to local baselines. A sentiment of 3.70 in Brazil is 0.15 points above the country’s average and represents strong performance.
Whereas, a 4.10 score in Switzerland is below local norms and signals room for improvement.
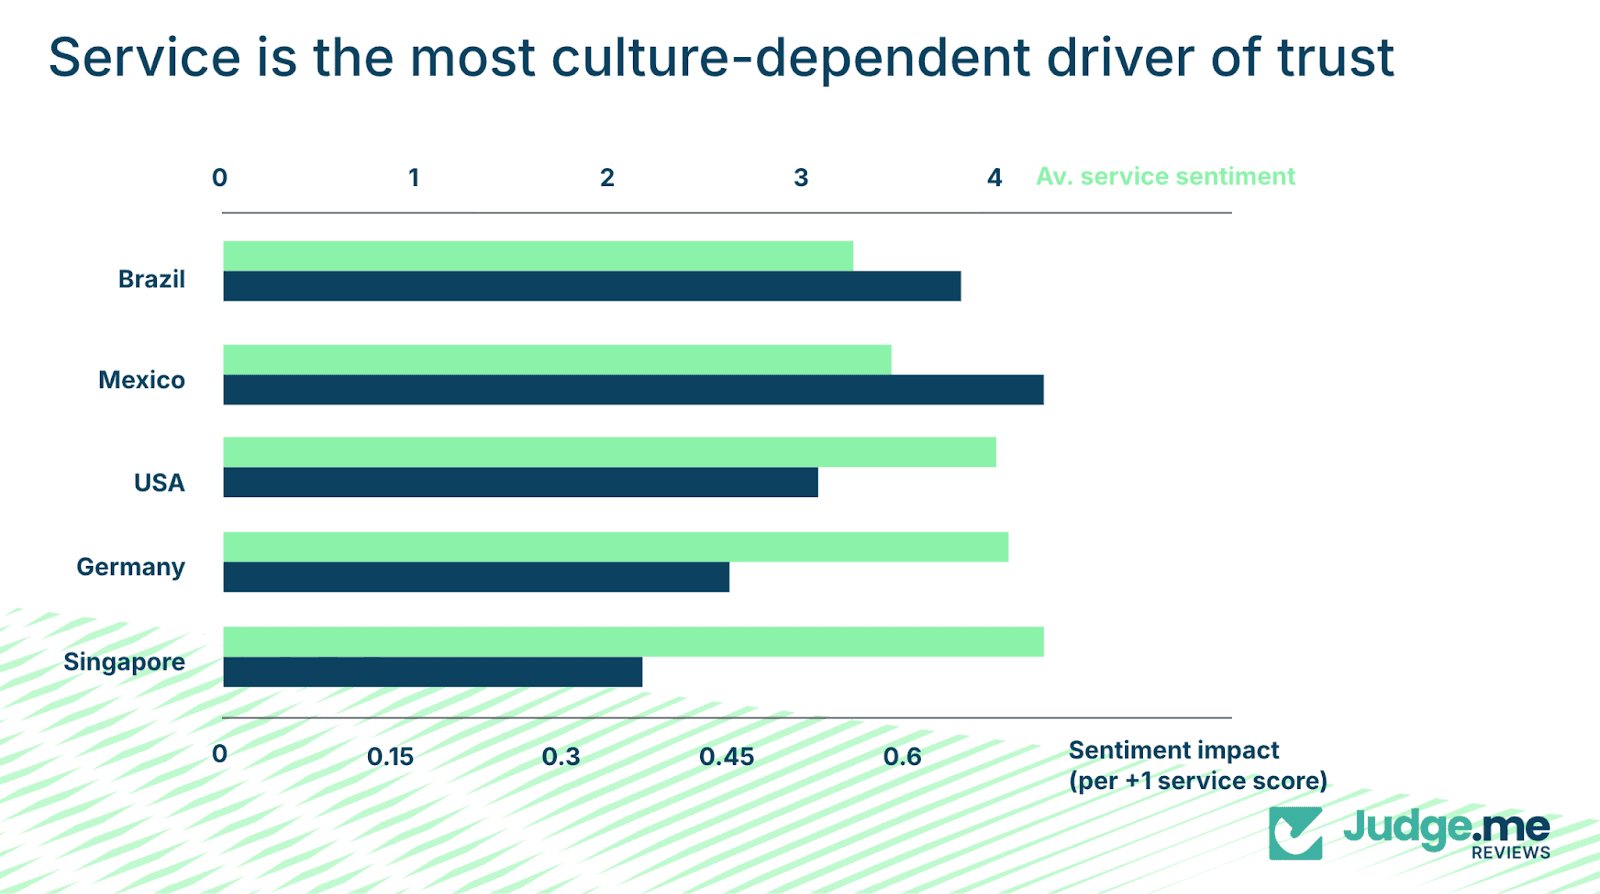
Service impact varies significantly by geography. For example, service has a coefficient of 0.15 in Germany but 0.45 in Brazil.
The role service plays in building trust will depend heavily on what customers consider to be meaningful support.
Service sentiment follows similar patterns:
Brazil: 2.8/5
Mexico: 3.0/5
USA: 3.2/5
Germany: 3.6/5
Singapore: 3.8/5
In Germany, customers value efficiency and clarity. In Brazil, personal attention and responsiveness are more important.
Identical support interactions can therefore be interpreted differently depending on the market.
Key takeaways for merchants
Benchmark against the correct peer group.
Performance should be evaluated against local averages and category norms, not global figures.Focus on the multiplier that matters for your category.
Delivery for furniture, support capability for electronics, or balanced improvements for categories without strong skew.Adapt trust-building tactics to local expectations.
Reliability signals differ by culture. Understanding these expectations is necessary for achieving strong sentiment.
Category and geography influence how improvements convert into sentiment gains and, by applying context-specific strategies, brands operating at a bigger scale will produce more effective results.
Trust in e-commerce for 2026: Winning through reliability and transparency
Trust is becoming harder to capture and is shaped by whether a brand keeps its promises. Customers do not expect flawless execution, but they do expect clarity and fairness.
Value perception dominates the trust hierarchy because it captures whether the overall experience aligns with the investment.
Customers assess not only the product itself, but the entire journey surrounding it. Delivery transparency, product accuracy, quality consistency, and clear support all influence whether the purchase feels fair.
The shift taking place in 2025 moves brands away from competing on operational speed or feature volume and towards competing on reliability.
Brands that will outperform are those that communicate honestly, set accurate expectations, and deliver consistently.
——
Research Methodology & Data Sources
This section provides a comprehensive overview of the analytical methods, data sources, and validation procedures underpinning the findings in this report. The methodology has been designed to ensure rigorous, reproducible analysis while acknowledging the inherent limitations of observational research.
Dataset Scope
This analysis draws from Judge.me's global review database spanning over 600,000 Shopify merchant stores. The dataset includes millions of authentic customer reviews across diverse product categories, geographic markets, and merchant types.
Temporal coverage: Final iteration from 1 May 2025 to 1 September 2025
Review volume analyzed: Almost 7 million reviews
Geographic distribution: Reviews span 100+ countries, with detailed analysis focused on key markets including the USA, UK, Canada, Germany, France, Switzerland, Singapore, Brazil, Mexico, India, and others
Product categories: Furniture, Fashion & Apparel, Electronics, Food & Beverage, Health & Beauty, Digital Goods, Toys & Games, Books, Jewelry, Home & Garden, and others
Sentiment Analysis Approach
Review sentiment refers to the overall emotional tone expressed in written customer reviews, quantified on a five-point scale, where higher scores indicate more positive sentiment. This analysis uses a hybrid approach combining deep learning and rule-based methods to extract sentiment from review text.
Deep Learning Component: BERT Model
The primary sentiment extraction relies on the nlptown/bert-base-multilingual-uncased-sentiment model, selected for its balance of performance and efficiency with demonstrated effectiveness on product and service review data.
Model Specifications
Specification | Details |
|---|---|
Architecture | BERT-base with 110 million parameters |
Type | Multilingual, uncased variant |
Purpose | Fine-tuned for 5-star sentiment classification (1-5 scale) |
Language Support | Multilingual, supporting 100+ languages |
Model Training Methodology
The BERT model's training occurred in two stages:
Pre-training (Base BERT): The foundation model was pre-trained using self-supervised learning on large, unlabeled text corpora, including BookCorpus (~800M words) and English Wikipedia (~2.5B words).
No manual labeling was required at this stage. The model learned through Masked Language Modeling (predicting masked tokens in context) and Next Sentence Prediction (determining sentence relationships).
Fine-tuning (Sentiment Classification): The model was then fine-tuned for 5-star sentiment classification using labeled review data. The labeling approach uses user-provided star ratings as direct labels, with 1-star mapped to "very negative" through 5-star mapped to "very positive".
This approach assumes the review text content aligns with the user-provided star rating, allowing star ratings to serve as reliable sentiment labels for training.
Hybrid Sentiment Scoring
The final sentiment score combines 70% BERT-based analysis with 30% custom rule-based keyword matching. BERT captures context and meaning while the keyword system counts positive and negative words and phrases, with extra weight for longer, specific phrases. The final sentiment is a weighted average of both methods, converted to a 1-5 scale.
Sentiment differs from star ratings in that it captures the emotional "why" behind customer evaluations. The two metrics correlate for over 80%, but sentiment analysis enables topic-specific evaluation (e.g., sentiment about delivery, about product quality, about support) which star ratings cannot provide.
Topic Classification
Reviews are analyzed across multiple dimensions using pre-defined categories, each with its own keyword lists:
Perceived Value: Value for money, price fairness, cost-benefit perception
Product Excellence: Quality, performance, functionality, durability, design, features
Service Excellence: Customer support, responsiveness, problem resolution
Delivery Performance: Shipping speed, packaging quality, delivery reliability
Scores are calibrated through compression to reduce extremes and better align with user ratings. This hybrid approach balances deep learning context understanding with rule-based precision for domain-specific terms.
Statistical Methods
Regression Control Variables
After aggregation to the merchant level, to ensure robust and unbiased estimates, the following control variables were included in the regression models:
Temporal Controls
Month of year (1-12): Captures seasonality effects that may influence sentiment patterns
Quarter (Q1-Q4): Accounts for quarterly business cycles and trends
Day of week (Monday-Sunday): Controls for weekday versus weekend effects
Entity-Level Controls
Product category: Controls for category-specific sentiment patterns and expectations
Shop country: Accounts for regional and cultural differences in review behavior and sentiment expression
Contextual Controls
Total reviews for product: Controls for product popularity effects, as more-reviewed products may have different sentiment distributions
Reviewer history: Distinguishes first-time reviewers from repeat reviewers, as review behavior may differ
Reviewer verified status: Controls for reviewer credibility, as verified purchasers may provide different sentiment patterns than unverified reviewers
Multicollinearity Testing
Comprehensive multicollinearity testing was conducted using two complementary methods to ensure the reliability of coefficient estimates:
Correlation Analysis: Pairwise correlations between all predictor variables were examined. All correlations were consistently below 0.4, indicating low to moderate relationships between variables and suggesting no severe multicollinearity concerns.
Variance Inflation Factor (VIF): VIF coefficients were calculated for all predictor variables. All VIF values were within acceptable ranges (typically < 5), confirming that multicollinearity does not significantly inflate the variance of coefficient estimates. These results indicate that predictor variables are sufficiently independent, allowing for reliable interpretation of individual variable effects.
Linear Regression Modelling
Linear regression was used to identify the strength and direction of relationships between specific touchpoint sentiment scores and overall review sentiment. Coefficients indicate how much a one-unit change in a specific touchpoint (e.g., delivery sentiment) is associated with a change in overall sentiment, controlling for other factors. For example, a coefficient of 0.77 for product quality means that a one-point increase in product quality sentiment is associated with a 0.77-point increase in overall sentiment.
Decision Tree Analysis
Decision tree analysis (max_depth=4) was employed to identify interaction effects and threshold points. This reveals how combinations of factors (e.g., high product quality plus poor delivery) create non-linear impacts on overall sentiment.
Model Performance Metrics
The analysis evaluated how well topic-level sentiments (at different hierarchical levels) predict overall sentiment scores:
Metric | Linear Regression | Decision Tree |
|---|---|---|
R² (Variance Explained) | 0.3103 (31.03%) | 0.4959 (49.59%) |
RMSE | 0.7160 | 0.6625 |
The Decision Tree model shows both higher explanatory power (R²) and lower prediction error (RMSE), indicating better model performance. The RMSE values (0.66-0.72 on a 1-5 scale) suggest reasonable prediction accuracy, with average errors of less than one point on the sentiment scale.
Model Validation
A two-stage validation process was conducted to ensure analytical rigor:
Stage 1: BERT Sentiment Accuracy Validation
The BERT model's ability to predict sentiment from review text was validated by comparing predicted sentiment scores against actual user ratings. The model achieved accuracy of 75%+ when predicting 5-star ratings from review text, demonstrating that the BERT model effectively captures sentiment signals from review text and provides a reliable foundation for downstream analysis.
Stage 2: Topic Sentiment Prediction Validation
The regression models' ability to predict overall sentiment from topic-level sentiments (at different hierarchical levels) was then validated. The R² and RMSE metrics reported above demonstrate that topic-level sentiments (individual topics, subcategories, and main categories) are effective predictors of overall sentiment, with the hierarchical structure contributing meaningful signal.
Segmentation Analysis
Reviews are segmented into performance groups for comparative analysis:
Top 10% segment: Reviews with overall sentiment in the top decile
Bottom 10% segment: Reviews with overall sentiment in the bottom decile
Top 50% vs Bottom 50%: Median-split comparisons
Comparing average touchpoint scores, mention frequencies, and sentiment distributions across these segments reveals which factors distinguish exceptional experiences from poor ones.
Causal Inference Methodology
While correlation does not imply causation, methods beyond simple correlation analysis were employed to strengthen causal inference where directional claims are made in this report.
Cross-Lagged Panel Design
The relationship between topic-level sentiments and overall sentiment was tested using a cross-lagged panel design to establish temporal precedence, utilizing the monthly structure of the data:
Forward Direction: Tested whether topic sentiments at time t predict overall sentiment at time t+1
Reverse Direction: Tested whether overall sentiment at time t predicts topic sentiments at time t+1
Comparison: Evaluated the relative strength and significance of each direction across different hierarchical levels (individual topics, subcategories, main categories)
Key Findings
The forward direction (topic sentiments → overall sentiment) showed strong statistical significance and greater effect size than the reverse direction. This temporal asymmetry – where topic-level sentiments precede and more strongly predict future overall sentiment than vice versa – provides evidence for a directional causal relationship. The effect was consistent across different levels of the topic hierarchy, suggesting that topic-specific sentiment components contribute to overall sentiment formation.
Key Metrics Explained
Impact Coefficient: The strength of relationship between a specific factor and overall sentiment, derived from regression analysis. Higher absolute values indicate stronger influence.
Mention Frequency: Average number of times a specific topic is referenced per review. High mention frequency, especially combined with neutral or negative sentiment, indicates friction points.
Sentiment Drop/Lift: The change in average sentiment score between comparison groups (e.g., top vs bottom segments, positive vs negative reviews).
Sensitivity: Category- or geography-specific impact coefficients, showing how much a one-point improvement in a specific touchpoint affects overall sentiment within that context.
Data Accessibility
Raw data is accessible upon request. Judge.me maintains the original review data, including review text (title and body), metadata (review IDs, shop IDs, product IDs, ratings, timestamps), and derived features and model outputs. Data access can be arranged through appropriate channels with necessary privacy and security considerations.
Limitations & Interpretive Notes
This analysis reflects patterns in written review content. Several limitations should be acknowledged:
Selection bias: Customers who leave reviews may differ systematically from those who don't, though Judge.me's scale (600,000+ merchants) mitigates this bias substantially.
Observational data limitations: Without experimental manipulation, definitive causality cannot be established. While the cross-lagged analysis provides evidence for directional relationships, controlled experiments would be required to establish definitive causal claims.
Potential confounders: Unmeasured variables may still influence both topic sentiments and overall sentiment.
Bidirectional relationships: Feedback loops may exist, though our analysis suggests topic sentiments are the stronger driver.
Aggregation effects: Overall sentiment may be an aggregation of topic sentiments by definition, which complicates causal interpretation.
Geographic and category variation: Findings represent broad patterns. Individual merchant performance can vary significantly based on positioning, target audience, and execution quality.
Interpretive Framework
Given these findings and limitations, directional claims in this report should be interpreted as: "Topic-level sentiments appear to be causal drivers of overall sentiment formation" rather than absolute causal claims. The cross-lagged analysis provides evidence for this directional relationship, supported by temporal precedence and asymmetric effect sizes, while acknowledging the inherent limitations of observational data.
Commercial application: In business contexts, this evidence is sufficient to inform strategic decisions about focusing on specific topic areas (e.g., product quality, customer service, shipping) as levers for improving overall sentiment, while recognizing that experimental validation would provide the strongest causal evidence.
All findings are based exclusively on authentic, unsolicited customer reviews. No synthetic data or hypothetical scenarios are included.


